These data were provided by Immigration, Refugees and Citizenship Canada and give counts of Permanent residents at the Census Subdivison level. Note that the province/territory and census division values are included in the CMA-CA table. The data for both Census Division and Census Subdivision is available from 1999-2022 here: https://communitydata.ca/data/ircc-permanent-resident-admission-tables-cd-and-csd-landing-years-1999-2022
There are 6 tables included which each disaggregate the permanent resident admissions data by different dimensions. The following tables are included:
For Census Subdivision:
- Admissions of Permanent Residents by Census Subdivision of Intended Destination, Family Status, Immigration Category, Age Group and Gender
- Admissions of Permanent Residents by Census Subdivision of Intended Destination, Family Status, Immigration Category, Country of Birth World Area and Gender
- Admissions of Permanent Residents by Census Subdivision of Intended Destination, Country of Birth World Area, Immigration Category, and Gender
- Admissions of Permanent Residents by Census Subdivision of Intended Destination, Education Qualification, and Gender
- Admissions of Permanent Residents by Census Subdivision of Intended Destination, Age Group and Gender
- Admissions of Permanent Residents by Census Subdivision of Intended Destination, Intended Occupation (2-digit NOC 2011) and Gender
Glossary
IRCC has provided this document, which contains an overview as well as a glossary of terms and concepts.
https://www.ircc.canada.ca/opendata-donneesouvertes/data/Facts_and_Figures_2017_TR_EN.pdf
Suppression and Rounding
Please note that in these datasets, the figures have been suppressed or rounded to prevent the identification of individuals when the datasets are compiled and compared with other publicly available statistics. Values between 0 and 5 are shown as “--“ and all other values are rounded to the nearest multiple of 5. This may result in the sum of the figures not equating to the totals indicated.
Reading the tables:
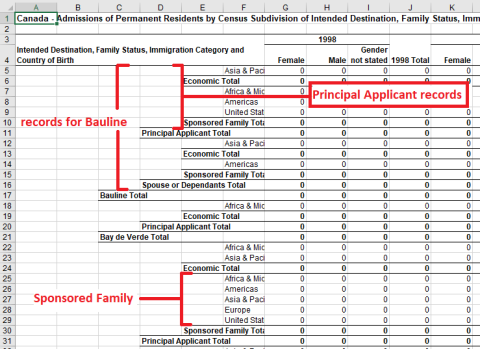
The names of variables and geographies are indicated in the "Total" line below the relevant records. In the example shown below, rows 5 to 10 are for Principal Applicants in the CSD of Bauline.

Note that the CMA-CA file also contains provincial values.