Data
The catalogue of data products, infographics and dashboards accessible to Immigration Sector Network members is available here.
Membership
If your LIP is already a full member of the CDP, you can register a new account here. Once your account is activated, you can start looking for data here.
If your LIP is not a member of the CDP but would like to join a data consortium in your local community, learn how to become a member here.
If your LIP cannot join a data consortium or there isn’t one in your community, it can join the CDP's Immigration Sector Network:
- First, register your LIP here.
- Under "Consortium," please select "Immigration Sector Network."
- Once your organization's registration has been approved, you can register a user account here.
Users may download products from the catalogue only once their user account has been activated.
Guides
For more information, please refer to these step-by-step guides:
- Registering and Creating a User Account
- Accessing data using the Beyond 20/20 data tool
- Accessing Dashboard and infographics using Tableau Data Tool
A video orientation for the Immigration Data Portal is available here: https://youtu.be/SnkgRLrGisc
For an orientation of the Beyond 20/20 software, skip ahead to the 30-minute mark of this orientation: https://communitydata.ca/resources/webinars/orientation-aug-16
You can also contact information@communitydata.ca if you have any questions about the data or this data portal.
Webinars
- December 5, 2024: IMDB, Housing, Permanent and Temporary Resident Data for Local Immigration Partnerships (LIPs)
- July 27, 2023: Immigration Data Portal: Orientation to ICARE, IMDB and 2021 Census Data Tables, Dashboards and Infographics
- November 9, 2022: How to effectively use Core and ICARE IMDB Tables
- September 27, 2022: What can I do with the Longitudinal Immigration Database [IMDB]?
- March 9, 2022: National LIP Secretariat Webinar on Community Data Program, Data Access and Visualization
- June 25, 2020: Resources for the Local Immigration Partnership Portal
See the full list of upcoming and past webinars here. Recordings are available for most past webinars.
Infographics and Dashboards
Immigration and Housing Dashboard, 2021Image

This dashboard presents data from a collaboration between the Community Data Program and the National Local Immigration Partnership Secretariat. While its primary focus is on housing characteristics, we have also extracted additional insights from the data source, resulting in the inclusion of tabs beyond housing-related topics. |
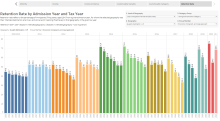
Longitudinal Immigration Database Dashboard, 2015-2021Image

The Longitudinal Immigration Database Dashboard presents data from IMDB tables 1-10 in a series of interactive charts. The charts compare data on immigrant taxfiler mobility and income with admission categories, world areas of birth, known languages, citizenship status, pre-admission experience, age, and gender covering the tax years 2015 to 2021. An instructional video for the Longitudinal Immigration Database Dashboard, 2015-2021 is available here. |
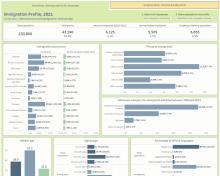
Immigration Profile Dashboard, 2021Image

The Immigration Profile Dashboard, 2021 displays a profile of the immigrant population in a selected community, using data from the 2021 Census. The dashboard provides an overview of immigration and looks at demographics, language, education, employment and income for the immigrant and recent immigrant populations. The data in this dashboard covers all of Canada at the following levels of geography: Canada, Provinces and Territories (PR), Census Divisions (CD), Census Subdivisions (CSD), and Local Immigration Partnership (LIP) boundaries. |
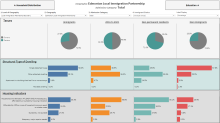
Longitudinal Immigration Database ICARE Dashboard, 2012-2019Image

The Longitudinal Immigration Database ICARE Dashboard presents data from the IMDB ICARE tables T1 and T2 in a series of interactive charts. Data on immigrant taxfiler mobility and economic outcomes are compared with settlement service delivery, admission categories and world areas of birth. The dashboard includes time series showing data on immigrant taxfiler landing groups over time, and charts showing data for individual tax years. An instructional video for the Longitudinal Immigration Database ICARE Dashboard, 2012-2019 is available here. |
Census Profile 2021: Immigration, Mobility, Ethnocultural and Religious Diversity DashboardImage

The 2021 Census Profile: Immigration, Mobility, Ethnocultural and Religious Diversity Dashboard displays data from Statistics Canada's 2021 Census Profile on the topics of immigration, place of birth, mobility, and ethnocultural and religious diversity. This dashboard allows users to view 2021 Census indicators in an interactive map and generate detailed profiles of individual geographies. |
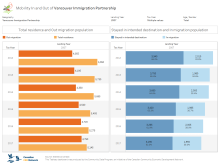
Mobility In and Out of Local Immigration Partnerships DashboardImage

The Mobility In and Out of Local Immigration Partnerships Dashboard visualizes immigrant mobility data for custom LIP geographies using the Longitudinal Immigration Database [IMDB]. This dashboard allows you to compare mobility indicators by immigration admission category, admission year (or landing year), tax year, age and gender of immigrant taxfilers |
Profile: All Immigrants, 2016Image

This interactive Tableau dashboard allows you to view a selection of census variables for the immigrant population at a geography of your choice. |
Profile: Recent Immigrants, 2016Image

This interactive Tableau dashboard allows you to view a selection of census variables for the recent immigrant (period of immigration 2011-2016) population at a geography of your choice. |
To open these dashboards, you will need Tableau Reader installed on your computer. Tableau Reader can be downloaded here.